Most weekly reports fail for the same reason: they are organised around the data the team happens to have, one page per source system or one page per chart type, instead of around the decisions the meeting makes. The agenda is the specification.
What a Weekly Trading Report Has to Answer
The report exists to produce decisions: replenish, mark down, cancel intake, rebalance stock between channels. Anything that does not lead to one of those belongs in a monthly pack.
That has a practical consequence for the build. Before any modelling, write the four questions down and show them to the people who sit in the meeting. If a visual on page two does not help answer question two, it comes off the page. A trading report with forty visuals is a report nobody reads past the first ten minutes.
The Four Pages of a Weekly Trading Report in Power BI
| Page | The question it answers | What goes on it |
|---|---|---|
| 1. Trade summary | Did we hit the plan last week? | Sales value and units for the week against plan and against last year on aligned weeks; the same three for month to date and season to date; margin and full-price share; one variance line, not twelve |
| 2. Where the gap came from | Which part of the business moved? | The same variance split by channel, market, department and category; a waterfall from plan to actual; over- and under-performers ranked by the size of the gap rather than by sales |
| 3. Product detail | Which styles caused it, and what is the stock position? | Best and worst sellers by sell-through and by gap to plan; weeks of cover against intake already booked; size availability; aged stock |
| 4. Actions | What do we do this week? | Replenishment candidates with quantities, markdown candidates with stock value, intake to cancel or pull forward, each with an owner |
Page one is read by everyone; page four is the only one anybody acts on. Pages two and three exist to get from one to the other, and they are where filters earn their place: the same page serves the buying meeting and the finance review because the measures recalculate for whatever is selected.
One deliberate omission: no page shows a target that is not in the plan. A number with no plan behind it produces discussion rather than a decision.
The Measures a Weekly Trading Report Needs
Everything on those four pages is built from a small set of measures.
- Sales value and units, net of returns.
- Plan, and variance to plan in value, units and percent.
- Last year on aligned weeks, and variance to it.
- Sell-through: units sold over units received, or over received plus opening stock. One definition, written down.
- Weeks of cover: closing stock over the rate of sale on in-stock weeks.
- Full-price share of sales value.
- Intake: received in the week, and booked but not yet received.
- Stock value and units, as a semi-additive closing position rather than a sum across weeks.
The variance measures are the ones most often written as calculated columns, which is wrong: a variance has to recalculate for whatever the viewer has filtered.
Sales vs Plan % =
VAR Actual = [Sales Value]
VAR Plan = [Plan Value]
RETURN
DIVIDE ( Actual - Plan, Plan )Why a Weekly Trading Report Needs a 4-5-4 Retail Calendar
Comparing this week with the same week number last year only works if the two weeks are comparable. Under an ordinary calendar they are not: the number of weekends in a month changes from year to year, and weekends carry a growing share of sales.
That is the problem the 4-5-4 calendar solves. The National Retail Federation describes it as a voluntary guide the industry derived in the 1930s, splitting each quarter into months of four, five and four weeks so that holidays stay aligned and comparable months hold the same number of Saturdays and Sundays. Like days are compared with like days.
In a Power BI model this means the date table is a retail calendar rather than a Gregorian one: it carries fiscal year, fiscal week, period, quarter and a continuous week index. With that index, last year is an offset rather than a date calculation.
Sales LY (aligned weeks) =
VAR CurrentWeeks =
    VALUES ( 'Retail Calendar'[Week Index] )
VAR LastYearWeeks =
    TREATAS (
        SELECTCOLUMNS ( CurrentWeeks, "@Week", 'Retail Calendar'[Week Index] - 52 ),
        'Retail Calendar'[Week Index]
    )
RETURN
    CALCULATE (
        [Sales Value],
        REMOVEFILTERS ( 'Retail Calendar' ),
        LastYearWeeks
)The minus-52 shortcut breaks, and it is worth knowing when. A 52-week year is 364 days, so the retail calendar adds a 53rd week roughly every five or six years. NRF's rule is to add one when four or more days are left in January after week 52, and it names 2006, 2012, 2017 and 2023 as 53-week years. Across such a boundary, week index minus 52 lands on the wrong week and every year-on-year number in the report is quietly wrong by one week. NRF's own answer is to restate: shift each week back by one and ignore the first week of the 53-week year.
The robust build does the same thing in the model rather than in the measure. Put an explicit LY Week Index column in the calendar table with the restatement already applied, and have the measure read that column instead of subtracting 52. The arithmetic then survives the boundary year without anybody remembering to fix it.
Reading Stock Variance Against Sales Variance
The most useful chart on page two is not sales. It is sales variance plotted against stock variance, because the relationship between the two says whether a category is healthy.
The rule, as Style Arcade states it in their guidance on Monday trade reporting: sales variance should exceed stock variance. Their worked examples are 15% sales growth against 3% stock growth as a strong position, minus 7% against minus 15% as acceptable, and minus 15% sales against plus 25% stock as the one that needs a deep dive.
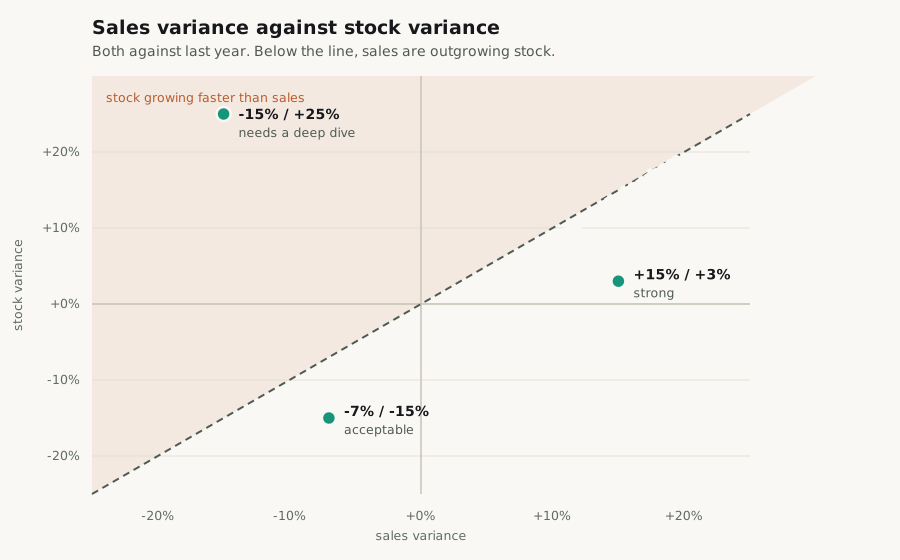
The diagonal is the rule. Anything below it is selling faster than the stock is growing; anything above it is accumulating. A category sitting well above the line with the season ending is a markdown decision, and it is better found on a chart than in a sorted table, because the eye catches the outlier before the ranking does.
Who Owns the Weekly Trading Report and When It Refreshes
A trading report is a scheduled obligation, not a dashboard somebody opens when curious. Three things have to be written down next to it, and all three are organisational rather than technical.
- One set of KPI definitions. Sell-through, cover and full-price share each have at least two defensible definitions; the report needs one of each, with the formula, the source and the owner recorded in a sheet everybody has signed off. Without it the meeting spends its first ten minutes reconciling numbers.
- A refresh that lands before the meeting, not during it. If the Monday meeting is at ten, the refresh and its check happen earlier, and a failed refresh has to be visible as a failure rather than as yesterday's figures presented as today's.
- A named owner per page, who prepares, checks and presents that part. The BI team is not an owner.
Mistakes That Make a Weekly Trading Report Useless
- Building the pages around data sources instead of the agenda. The meeting then jumps between pages, and the report is replaced by somebody's spreadsheet within a quarter.
- Comparing unaligned weeks. Without a retail calendar, every year-on-year number carries a calendar artefact nobody can separate from real performance.
- Ranking by sales instead of by gap. The biggest category is almost always at the top; the biggest problem rarely is.
- Showing stock as a sum across weeks. Stock is semi-additive: a month column that adds four weekly snapshots reports four times the stock the business holds.
- No plan on the page. A number without a plan generates opinions; a variance generates a decision.
- Forty visuals. Everything that does not lead to replenish, mark down, cancel or rebalance belongs in the monthly pack.